UCS Analyzer - Rock Strength & Laboratory Data Analysis
A Python-based rock mechanics application for processing UCS laboratory data, estimating strength and elastic properties, visualizing stress-strain behavior, and generating engineering reports.
Overview
Uniaxial Compressive Strength (UCS) testing is a fundamental laboratory method for characterizing the strength and deformation behavior of intact rock. Converting raw test data into useful engineering parameters, however, requires data preparation, stress-strain analysis, identification of the relevant elastic region, calculation of material properties, visualization, and documentation.
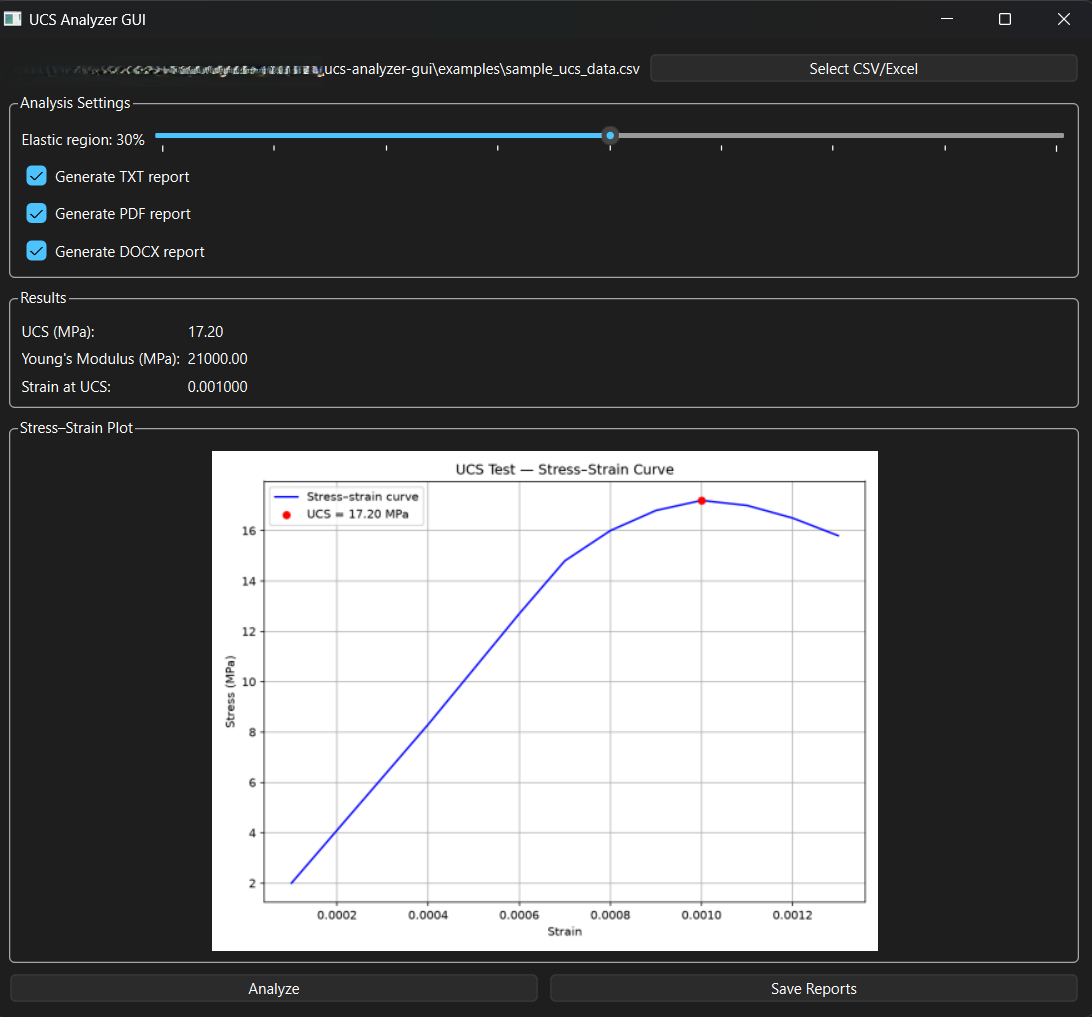
I developed the UCS Analyzer to bring these steps into a single Python-based workflow. The application accepts raw UCS test data in CSV or Excel format, processes the stress-strain relationship, allows the elastic region used for Young's modulus estimation to be adjusted, calculates key engineering parameters, generates plots, and exports the results in multiple report formats.
The project demonstrates how a laboratory testing workflow can be translated into a reproducible engineering data-analysis tool, reducing repetitive processing while keeping the calculation workflow transparent to the user.
Features
- CSV and Excel data input - Loads UCS laboratory data from common tabular formats, providing a practical starting point for processing test results.
- Stress-strain analysis - Processes the relationship between applied stress and strain and generates an engineering stress-strain curve for each analysis.
- Adjustable elastic region - Allows the user to define the portion of the stress-strain response used for Young's modulus estimation rather than relying on a completely fixed assumption.
- UCS calculation - Identifies the peak stress reached during the test and reports the corresponding uniaxial compressive strength.
- Young's modulus estimation - Estimates the elastic modulus from the selected elastic region of the stress-strain response.
- Strain at UCS - Reports the strain corresponding to the peak UCS value.
- Engineering visualization - Generates a stress-strain plot with the UCS point highlighted for easier interpretation of the test behavior.
- Multi-format reporting - Exports analysis results in TXT, PDF, and DOCX formats for documentation and further engineering use.
Tech Stack
GitHub Repository
The complete source code, documentation, examples, analysis methodology, and implementation details are available in the GitHub repository.
View on GitHubInstallation & Usage
Run the application locally by cloning the repository, installing the required Python dependencies, and launching the PySide6 desktop interface:
git clone https://github.com/mbalandari/ucs-analyzer-gui.git
cd ucs-analyzer-gui
pip install -r requirements.txt
python -m gui.app