Triaxial Test Analyzer
A Python-based rock mechanics application for processing triaxial test data, evaluating peak strength under confinement, generating Mohr circles, fitting Mohr-Coulomb failure envelopes, and producing engineering reports.
Overview
Triaxial testing provides a way to investigate the strength and failure behavior of rock under different confining pressures. Interpreting a series of triaxial tests requires more than identifying the peak strength of individual specimens: the results must be transformed into principal stress states and evaluated together to characterize the overall failure envelope.
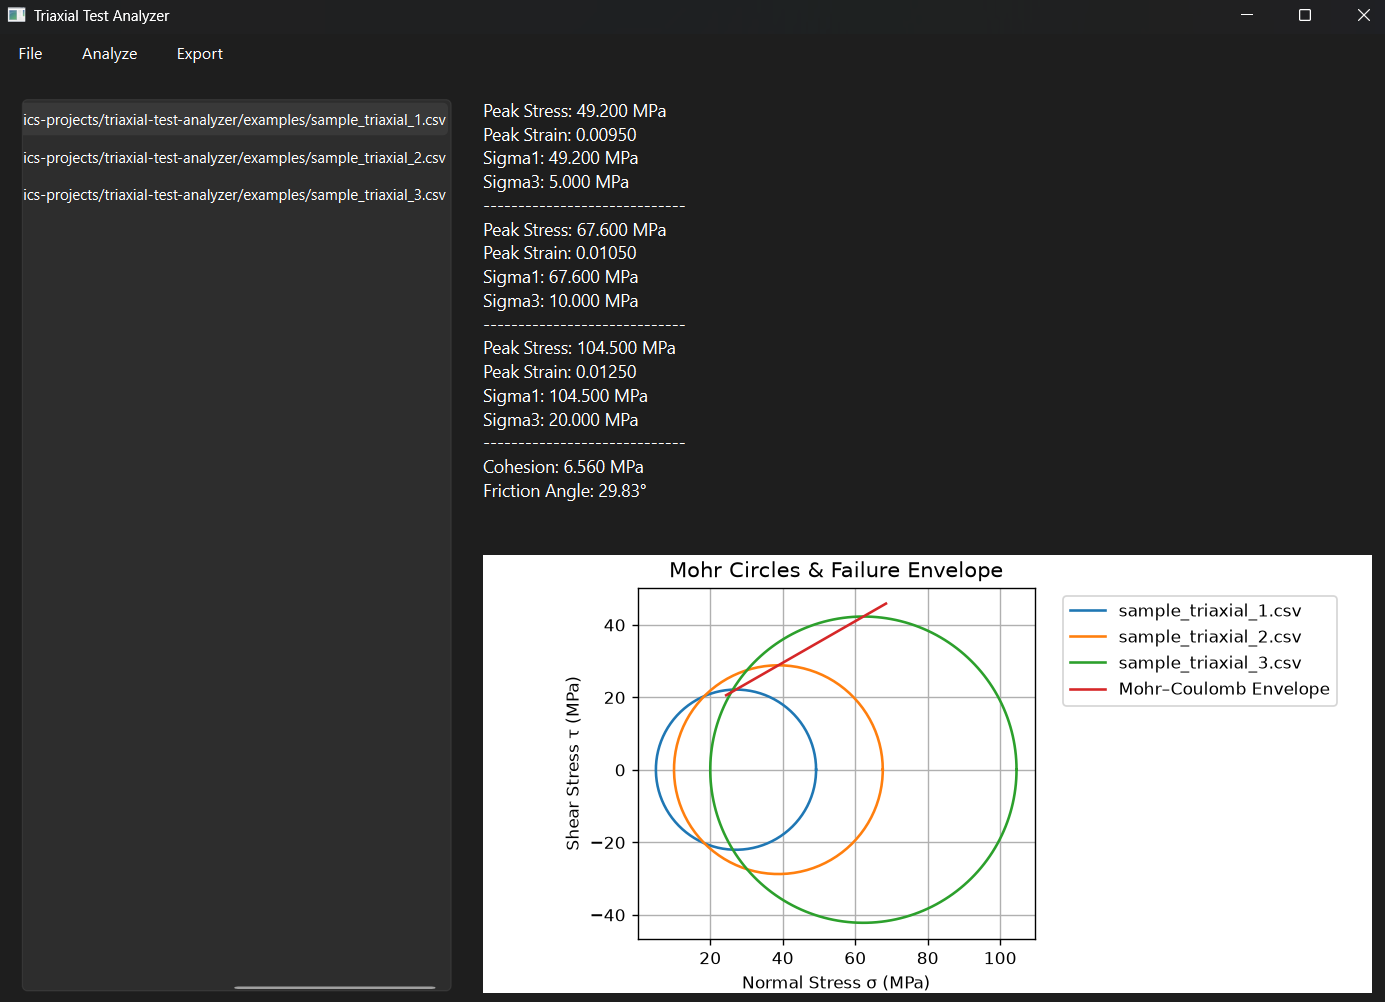
I developed the Triaxial Test Analyzer to organize this workflow into a single Python-based application. The tool accepts triaxial test data, identifies peak stress and strain for each test, calculates the relevant principal stresses, generates Mohr circles, and fits a linear Mohr-Coulomb failure envelope across the test series.
The resulting analysis provides estimates of key shear-strength parameters, including cohesion and friction angle, while the graphical output makes the relationship between confinement, peak strength, and failure behavior easier to inspect and communicate.
Features
- CSV and Excel test-data input - Loads triaxial test datasets from CSV and XLSX files for analysis.
- Peak strength identification - Determines peak stress and corresponding strain for each triaxial test under its specified confining pressure.
- Principal stress calculation - Calculates the relevant major and minor principal stresses used to construct the stress state at failure.
- Mohr circle generation - Generates correctly scaled Mohr circles from the calculated principal stresses, with tangent points and an overlaid failure envelope.
- Mohr-Coulomb envelope fitting - Fits a linear failure envelope to the triaxial test results to characterize the relationship between normal and shear stress.
- Strength parameter estimation - Calculates the corresponding cohesion and friction angle from the fitted failure criterion.
- Engineering visualization - Produces graphical outputs that make the relationship between confining pressure, peak strength, and failure behavior easier to interpret.
- Automated report generation - Exports analysis results and Mohr-circle plots in TXT, PDF, and DOCX formats.
Tech Stack
GitHub Repository
The complete source code, documentation, example datasets, tests, and implementation details are available in the GitHub repository.
View on GitHubInstallation & Usage
Run the application locally by cloning the repository, installing the required Python dependencies, and launching the PySide6 desktop interface:
git clone https://github.com/mbalandari/triaxial-test-analyzer.git
cd triaxial-test-analyzer
pip install -r requirements.txt
python -m gui.app