Rock Mass Classification Tool
A Python-based engineering application for rock-mass characterization using RMR, Q-System, and GSI, with integrated visualization, preliminary support assessment, and automated report generation.
Overview
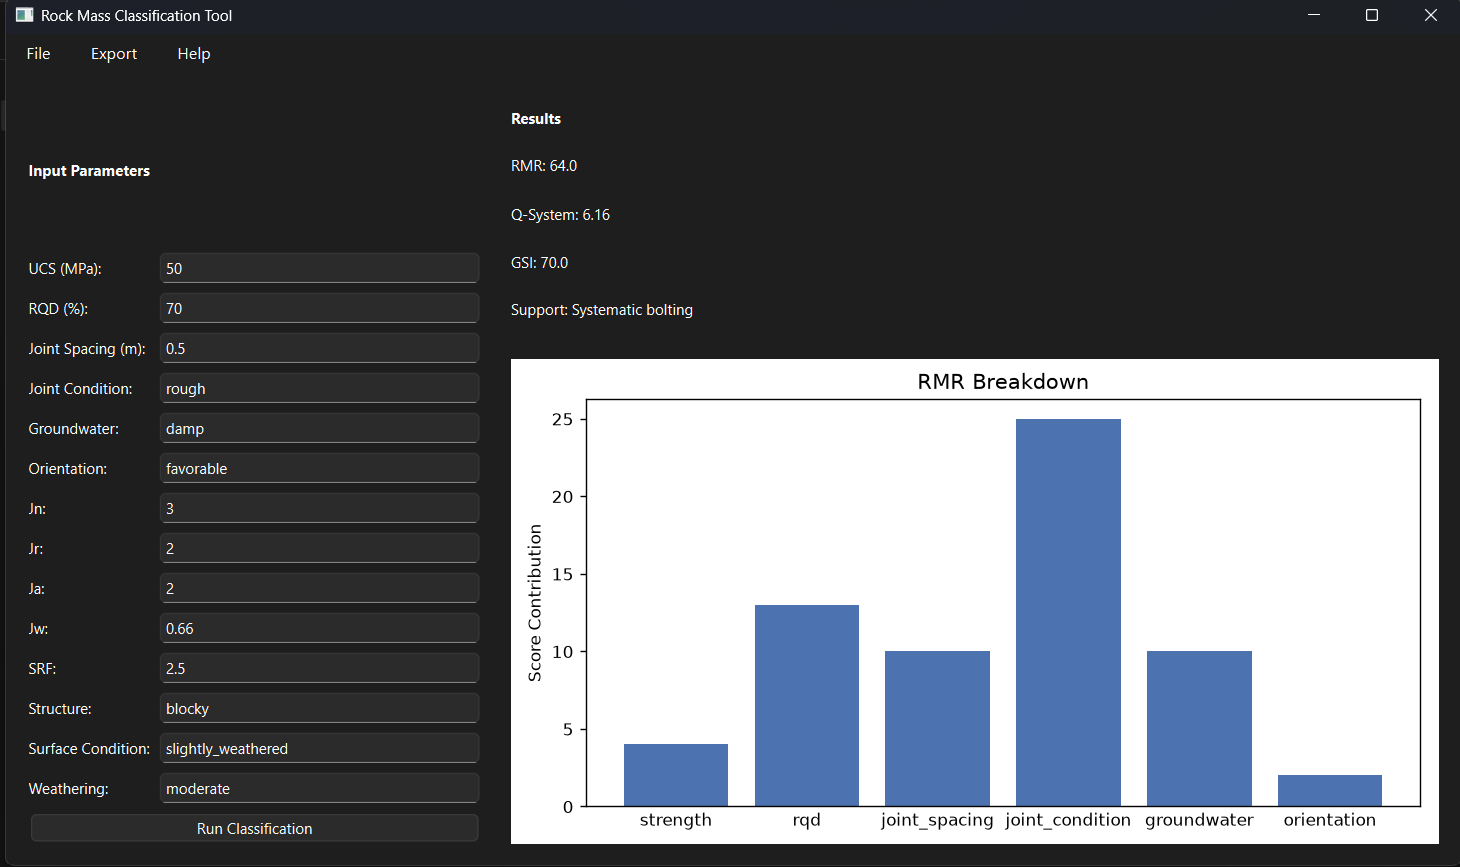
Rock-mass characterization involves the evaluation of geological and geotechnical parameters through established classification systems such as RMR, Q-System, and GSI. In practical engineering workflows, these assessments can involve repetitive parameter entry, calculations, interpretation of classification results, visualization, and preparation of technical documentation.
I developed this application to bring these steps into a single, structured Python-based workflow. The tool allows engineering parameters to be entered through a graphical interface, calculates the selected classification indices, presents the results through dedicated engineering visualizations, provides preliminary Q-based support recommendations, and generates structured reports for documentation.
The project was designed not simply as a calculator, but as an example of how rock mechanics methodologies can be translated into maintainable engineering software.
Features
- RRMR calculation with component-level breakdown - Calculates Rock Mass Rating from UCS, RQD, discontinuity spacing, discontinuity condition, groundwater conditions, and orientation adjustment, while showing the contribution of individual parameters.
- Q-System analysis - Calculates the Q-value from RQD, joint set number (Jn), joint roughness (Jr), joint alteration (Ja), water reduction factor (Jw), and stress reduction factor (SRF), with term-by-term transparency.
- GSI estimation and visualization - Estimates GSI using the implemented rock-mass structure and surface-condition classifications and presents the result graphically.
- Preliminary support assessment - Generates simplified Q-based support recommendations using the implemented threshold-based classification logic.
- Engineering visualization - Produces RMR contribution bar charts, Q-System radar charts, and GSI structure-domain diagrams for easier interpretation and reporting.
- Automated engineering reports - Exports calculated results, parameter breakdowns, charts, and recommendations in PDF, DOCX, and TXT formats.
Tech Stack
GitHub Repository
The complete source code, documentation, examples, tests, and implementation details are available in the GitHub repository.
View on GitHubInstallation & Usage
Run the application locally by cloning the repository, installing the required Python dependencies, and launching the PySide6 GUI:
git clone https://github.com/mbalandari/rockmass-classification-tool.git
cd rockmass-classification-tool
pip install -r requirements.txt
python -m gui.app